

← Back to Ash2Soil
Baseline Results
Study of Fire Effect in Soil Conditions
Physical and Chemical Analysis
Study design
Comparing soil conditions in burnt and unburnt Pine forest plots.
Test plots
 NCBurnt forest(Negative Control)
 ISBurnt forest(Intervention site)
 PCUnburnt forest(Positive Control)
Timeline
- Summer 2025
 Wildfire
- March 2026
 Soil Sampling
-
 Ash2Soil Intervention Site
- February 2027
 Assessment of intervention effect
Location
Ourondo, Covilhã, Portugal
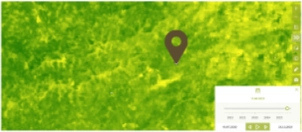
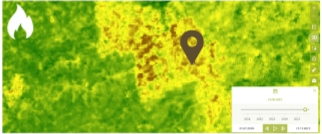
NDVI scale*
Dead plantStressed plantModerately stressed plantHealthy plant
*Normalized Difference Vegetation Index: measure the health, density, and amount of living vegetation using satellite imagery or remote sensing
Results

Texture
Feel Method
NC
- Relatively coarse
- Rapid infiltration and drainage
- Lower water- and nutrient-holding capacity
- Prone to erosion
IS
- Fine-textured
- High water- and nutrient-holding capacity
- Slow drainage
- Prone to compaction when wet
PC
- Intermediate-to-fine texture
- Relatively high water and nutrient retention
- Moderate-to-slow drainage
- Vulnerable to compaction when wet

pH VALUE
All plots are acidic.
0
1
2
3
4
PCISNC
56
7
8
9
10
11
12
13
14
AcidicNeutralAlkaline

Cation exchange capacity and base saturation
| CEC (cmol⁺/kg) | BS (%) | ||
|---|---|---|---|
| NC | 2.93 cmol⁺/kg | 76.7% | |
| IS | 2.89 cmol⁺/kg | 53.7% | |
| PC | 2.98 cmol⁺/kg | 32.2% | |
All plots have very low CEC.Medium = 10-20 cmol⁺/kg | Very High > 40 cmol⁺/kg
Base saturation should always be read alongside CEC:P0 has high base saturation, but its very low CEC still limits the absolute reserve of Ca, Mg, and K.

Organic matter & macronutrients
NC*Very high C:N (17.3)
IS*Very high C:N (17.5)
PC*High C:N (14.6)